Parkinson's screening from a voice recording, a hand-drawn spiral and a brain scan. Every prediction comes with an explanation, and every explanation is put on trial.
A score tells you how often a model is right, never why. In medicine, a model that is right for the wrong reason is worse than useless, because it looks trustworthy.
So NeuroSense treats explanations as something to test, not decoration. Each model explains itself, and those explanations are measured to see whether the model is looking at the disease or at a shortcut.
15 acoustic features into a Random Forest, explained with TreeSHAP: which features pushed this recording towards Parkinson's, and by how much.
A fine-tuned ResNet18 per drawing, explained with Grad-CAM heatmaps of where the network looked. Kept next to a classic HOG + SVM baseline.
Split by patient, never by image, so no person's scans appear in both training and testing.
A heatmap can look convincing and mean nothing. I wrote five metrics once, unit-tested them on synthetic images with a known signal hidden in them, and ran every image model through the same set.
Remove the pixels it calls important. Does confidence collapse?
Reveal only those pixels. Does confidence come back?
How much of the heat lands on the object that should matter?
Scramble the weights. A real explanation should fall apart.
Add faint noise. A real explanation should hold still.
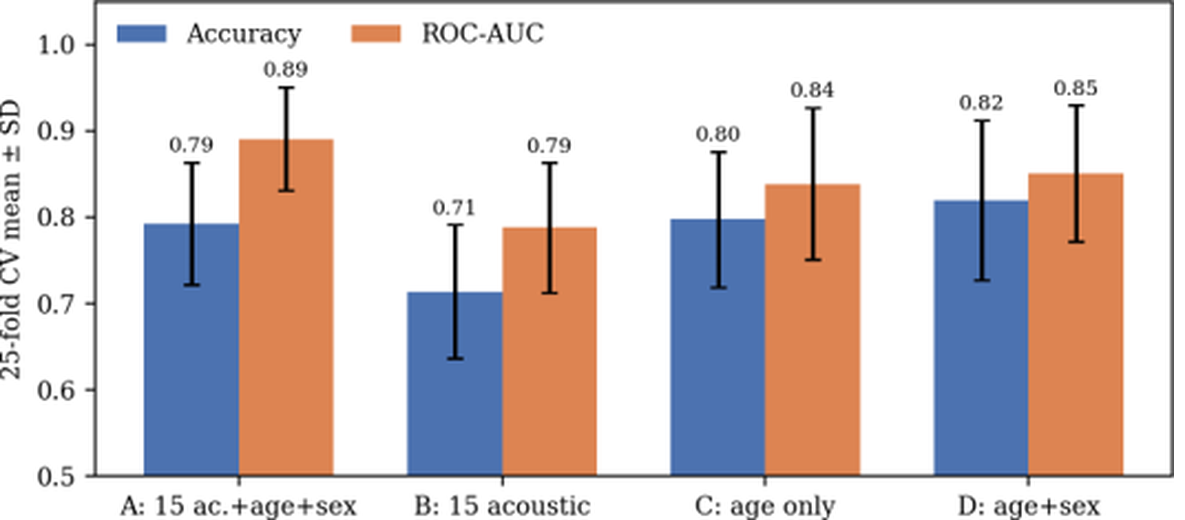
SHAP ranked age as the single most important input. Retraining under 25 cross-validation folds confirmed it: age alone scored as well as every acoustic feature plus age and sex combined.
The CNNs beat their SVM baselines and reached 0.97 AUC. The on-target metric showed why that number couldn't be trusted: over 99% of the Grad-CAM heat sat on margins, corners and paper texture, not on the pen strokes.
Insertion beat deletion every time, so the heatmaps were faithful to the model. The model just wasn't looking at the tremor. Faithful and meaningful are two different tests, which is why both are measured.

A perfect training score next to a below-chance test score was the clue. Each patient's folder mixed several kinds of scan, and the network had memorised the mix. I rebuilt the preparation to pick one structural series per patient.
Then the real answer showed up, on a second, independent dataset too: structural MRI shows anatomy, but early Parkinson's is a dopamine problem. No model can find a signal that isn't in the image. So I changed the image.
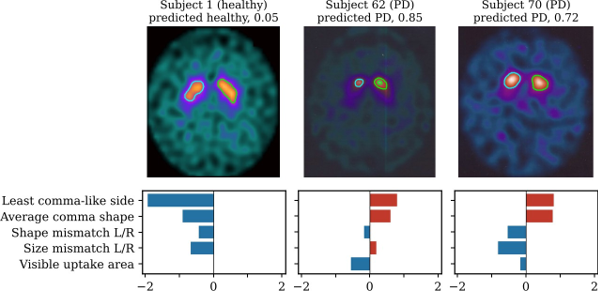
A DaT-SPECT scan shows the brain's dopamine system directly. In a healthy brain, two regions light up as commas. In Parkinson's, the tail fades and the comma shrinks into a dot.
Instead of asking a CNN to rediscover that, I measured it: five shape features, how comma-like each side is and how much the two sides differ, fed into a logistic regression. Because the model is linear, its explanation is exact: the bars add up to the score.

It held up under every check I threw at it: shuffled labels (200 times, p = 0.005), 20 alternative hand-set parameters, a control for image-export shortcuts, and added noise that flipped only 3.6% of decisions.
Balanced accuracy on patients the model never saw, over ten repeats of 5-fold cross-validation
Over a fine-tuned ResNet18 on the exact same folds
Smaller gap between training and test scores than the CNN: 2.5 points instead of 25
Features, each one something a clinician already reads off the scan
A Flask app takes a voice clip, a drawing or a scan and returns the prediction, its probability, the heatmap or SHAP breakdown, and a plain-language note on what the model used. The classic baselines sit right next to the CNNs, so any gain is visible.
It never crashes on a bad input: if weights, a library or an explainer fail, you still get the prediction with an alert. Seven models, tested metrics, smoke-tested routes, and every number in this project regenerates from saved results.